
What to Track in a Real Estate Agent Dashboard After Video Posts
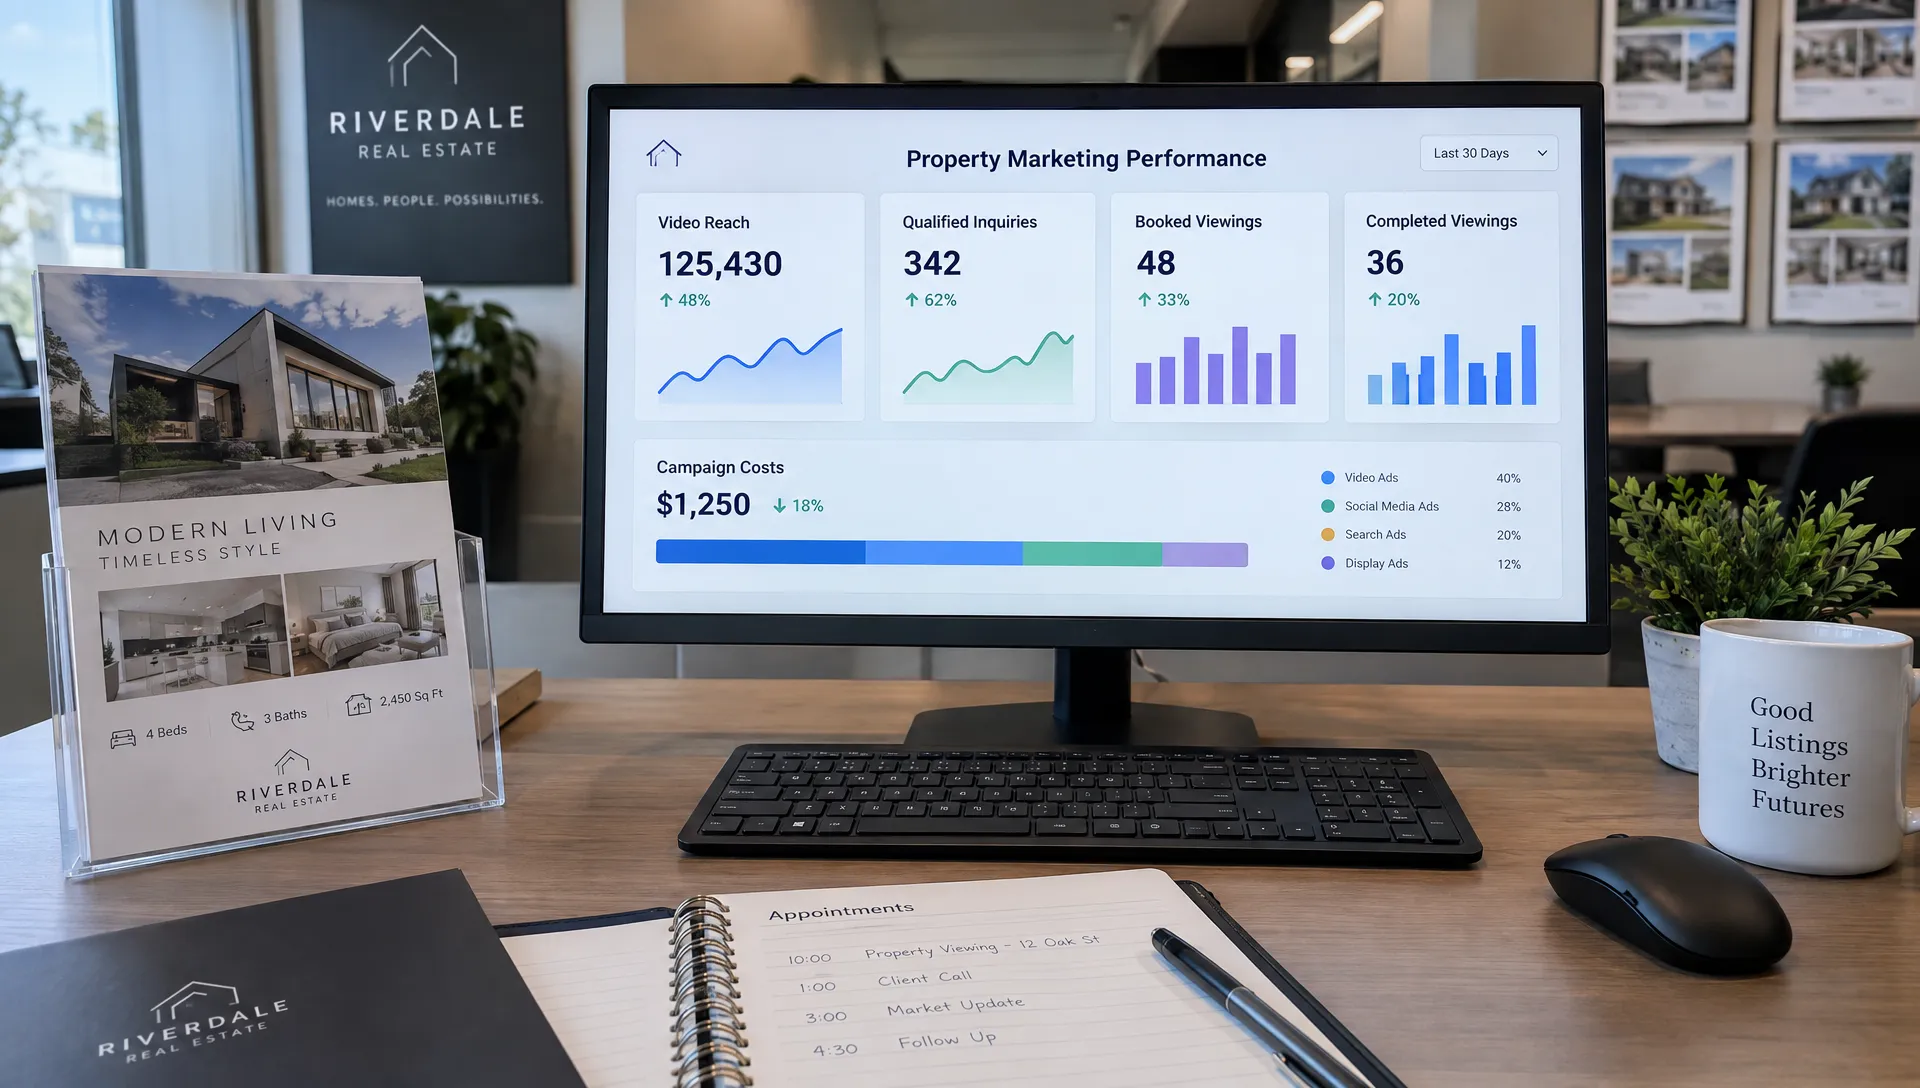
The real estate agent dashboard you check after publishing a listing video should answer a practical question: did this post move the right people closer to a viewing? Views help you understand distribution, but they do not tell you whether buyers asked useful questions, booked appointments or showed up. A useful dashboard connects attention to those outcomes without pretending that every sale can be traced to one reel.
For independent agents and small agencies, that does not require an elaborate reporting system. Start with a consistent listing identifier, a few clearly defined metrics and a way to connect inquiries to their source. Then review posts at comparable ages. The goal is to decide what to repeat, what to fix and where to spend your next hour or advertising dollar, rather than collect every number a platform offers.
Build a real estate agent dashboard around the next action
Organize your reporting around the journey from exposure to an actual conversation and viewing. Each metric should support a decision.
| Stage | What to track | Decision it supports |
|---|---|---|
| Distribution | Reach, plays and paid spend | Did the post receive enough exposure to evaluate? |
| Attention | Watch time, retention and completion | Did viewers stay long enough to see the property’s value? |
| Interest | Listing-page visits and relevant messages | Did viewers seek more information? |
| Qualification | Unique inquiries matching the listing | Did the campaign attract suitable prospects? |
| Appointments | Booked and completed viewings | Did interest become an attended appointment? |
| Efficiency | Production time and cost per outcome | Was the result worth the resources used? |
Keep a listing ID, post ID, platform, publication date and paid-versus-organic label alongside these numbers. Without those fields, a strong result can become impossible to reproduce.
Pull viewing data from social platforms, inquiry and appointment data from your CRM or lead log, and expenses from accounting records. Your reporting layer can be a spreadsheet or dashboard tool; it does not have to be part of the software that creates the video.
Read reach and retention together
Your real estate agent dashboard should distinguish whether a video was distributed from whether people watched it. Low reach and weak retention call for different responses.
Reach generally represents unique accounts exposed within a platform, while plays may include repeat viewing. Definitions vary, so preserve each platform’s metric labels. Do not add Instagram reach to another channel’s reach and describe the total as unique people.
For attention, record video length alongside average watch time and any available retention curve. A 12-second average means something different for a 15-second reel than for a 60-second walkthrough. Completion rates also need that context, and looping videos can complicate interpretation.
If viewers leave before the property appears, test a more direct opening. If they stay through the tour but rarely take the next step, examine the call to action and destination page. These are hypotheses to test, not proof that one element caused the result.
Compare similar properties, formats and audience types before judging performance. A paid waterfront listing video and an organic neighborhood update are not a useful head-to-head comparison. When you need to assess channel differences, use a consistent framework for comparing real estate advertising platforms for video, rather than ranking them by raw play counts.
Connect each post to its inquiries
A real estate agent dashboard becomes more useful when its inquiry records contain source evidence, not just a platform name selected from memory. Give each post a recognizable campaign label before publishing it.
For clickable links, use UTM parameters to identify the source, medium, campaign and creative version. A structure such as utm_source=instagram, utm_medium=organic_social and utm_content=kitchen_tour_v1 separates one post from another. Google’s Campaign URL Builder helps construct these tagged links, but your website analytics must still be configured to collect the visits.
Not every response follows a trackable link. Buyers may send a direct message, call later or find the listing on a portal. Record the originating post when it is known, use a listing-specific message prompt where appropriate, and ask how the person found the property. Keep self-reported sources separate from observed link activity.
Deduplicate contacts across channels so one buyer who messages and submits a form does not become two leads. Preserve both the original source and later meaningful interactions rather than overwriting the first source every time they return.
Use an “unknown” category when evidence is missing. Accurate uncertainty is more useful than assigning every untracked inquiry to your latest video. Tagged visits demonstrate a path to the website, not complete attribution of the eventual transaction.
Separate inquiries, qualified leads and completed viewings
Your real estate agent dashboard needs explicit definitions for each conversion stage. Otherwise, one agent’s “lead” may be a serious buyer while another’s is a comment asking about the paint color.
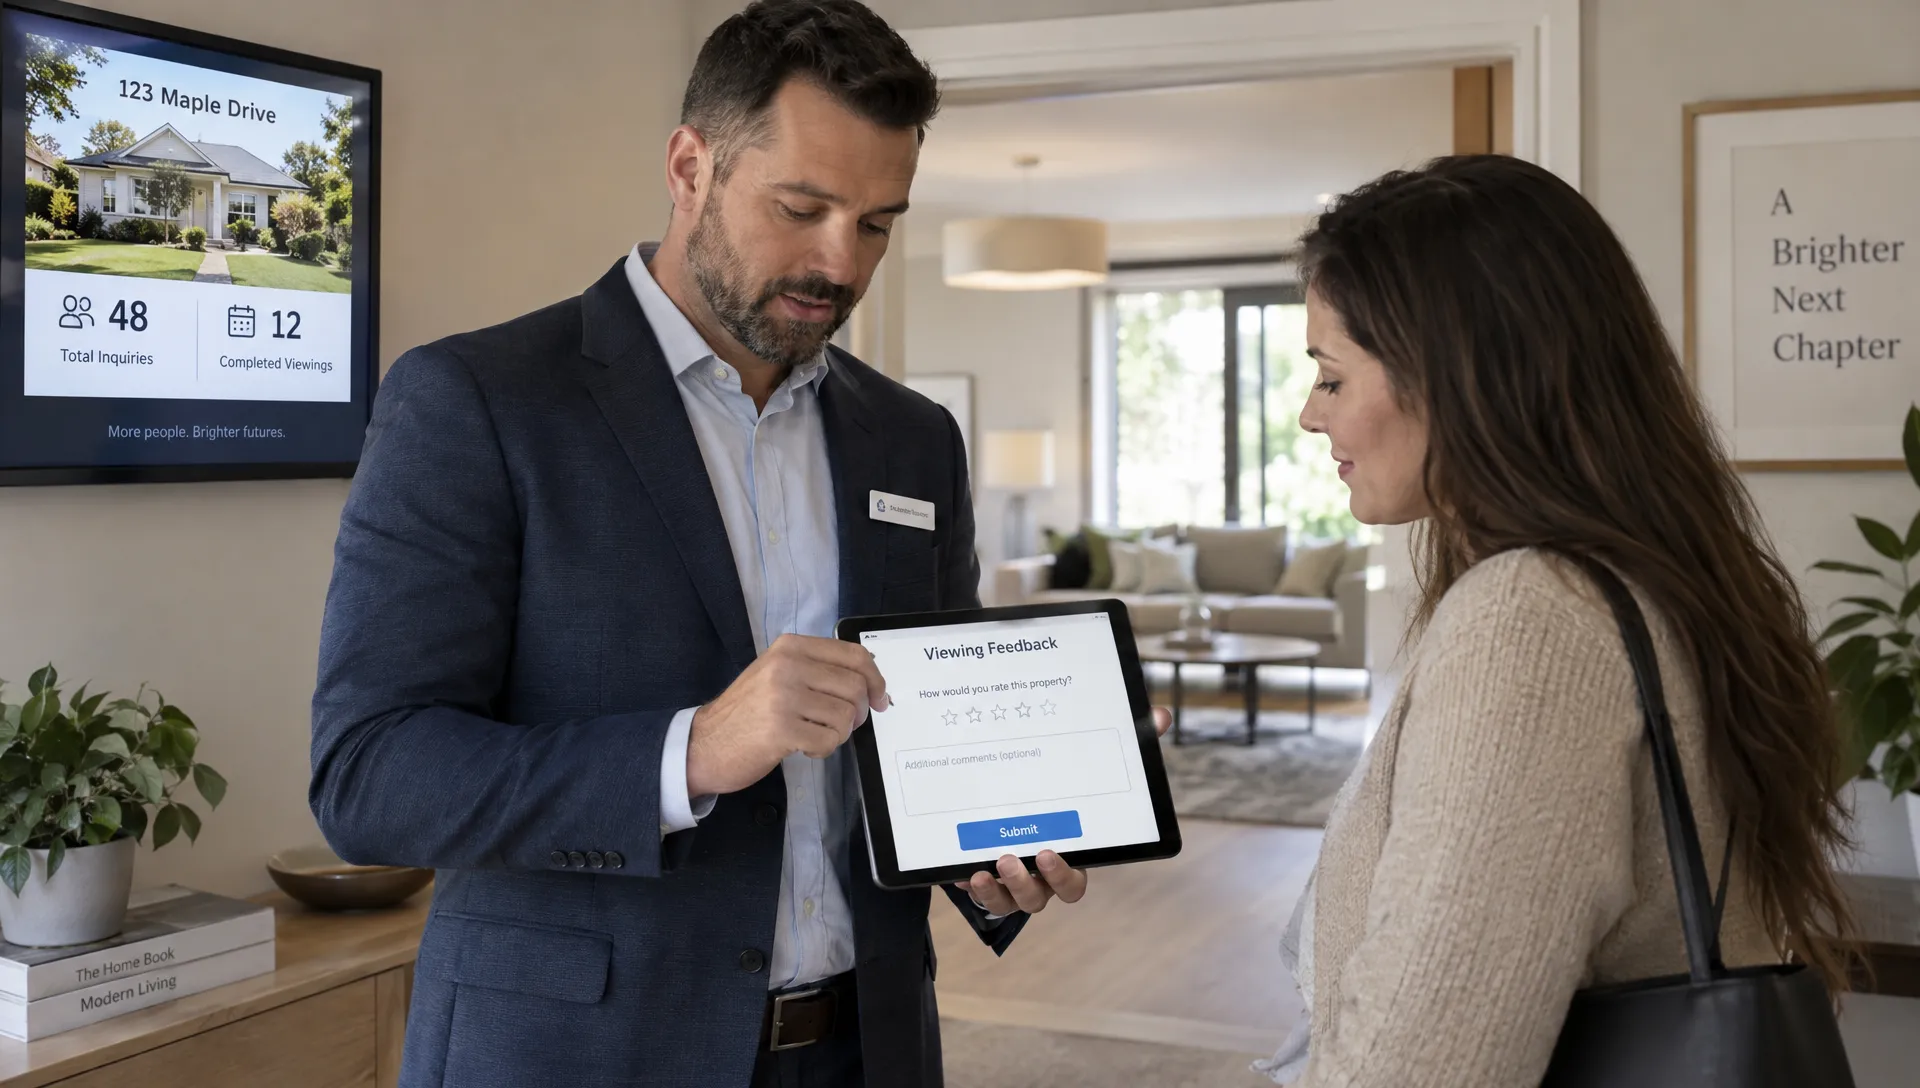
Count an inquiry when someone makes an identifiable request about the property. Mark it qualified when a conversation establishes relevant fit, such as the requested location, stated budget, property requirements and purchase timeline. Apply the same objective criteria across prospects; do not infer financial readiness from social profiles.
Keep booked viewings separate from completed viewings, and record cancellations and reschedules. Also measure first-response time during your working hours. A campaign that generates suitable inquiries can still lose opportunities during follow-up.
Illustrative example: A post produces eight unique inquiries, five qualified prospects, three booked viewings and two completed viewings. The qualified-inquiry rate is 5 ÷ 8, or 62.5%. Appointment conversion is 3 ÷ 5, or 60%. Attendance is 2 ÷ 3, or about 66.7%.
Those figures locate different points of friction; they are not industry benchmarks. Review the actual conversations before changing the video. For the follow-up side of this process, focus on turning video inquiries into booked appointments.
Calculate costs using consistent outcomes
Track paid distribution, video-production expenses and staff time separately. Organic posting can have no advertising charge while still consuming hours of work. Record production minutes first, then apply a consistent internal hourly rate if you want a fuller cost estimate.
Two useful calculations are cost per qualified inquiry and cost per completed viewing. Use costs and outcomes from the same campaign cohort, with an explicit reporting cutoff.
Continuing the hypothetical example, suppose the campaign costs $150 in advertising plus two production hours valued internally at $50 per hour. Its total allocated cost is $250. That produces a $50 cost per qualified inquiry and a $125 cost per completed viewing. These are management estimates, not claimed market averages.
The spending figures in your real estate agent dashboard should also reconcile with financial records. If an agency receives bank statements as PDFs, converting bank statements into verified Excel or CSV data can help check recorded payments against statement balances and totals. Match those payments to advertising invoices and campaign records, because a bank transaction alone does not identify which listing generated the expense.
Watch for timing differences, refunds and card payments that combine several purchases. Restrict access to financial files and report only the expense totals colleagues need.
Finally, keep eventual commission separate from early campaign efficiency. A transaction may involve several marketing interactions, negotiations and months of follow-up. Do not credit its full revenue to a single video merely because that video appeared somewhere in the buyer’s journey.
Review posts on a fixed schedule
Use a repeatable review rhythm instead of refreshing analytics throughout the day. A practical starting point is an early delivery check after 24 to 48 hours, a one-week engagement review and a later pipeline review around 30 days. Adjust those intervals to your market and sales cycle; they are working checkpoints, not universal performance standards.
At each review, save a dated snapshot. Your real estate agent dashboard should compare posts at similar ages, since a month-old video has had more time to accumulate inquiries than one published yesterday. Keep later outcomes attached to the original campaign cohort when that connection is supported.
Translate the evidence into one next action:
- Low exposure: Check publication settings, placement and distribution before judging the creative.
- Early viewer drop-off: Test a different opening while keeping the property and audience comparable.
- Attention without inquiries: Review the next-step instruction, contact route and listing-page experience.
- Qualified inquiries without appointments: Review response time, availability and follow-up conversations.
- Bookings without attendance: Examine confirmations, reminders and recorded cancellation reasons.
Change one major variable at a time when practical. With small samples, a single appointment can noticeably shift a percentage, so show counts beside rates and avoid declaring a winner too early.
For seller updates, summarize exposure, meaningful inquiries, completed viewings and the next planned adjustment. Agency owners should also retain listing context when comparing agents; different price bands and property types can produce very different response patterns.
Frequently asked questions
What is the most useful metric after posting a listing video? For a listing-focused campaign, completed viewings are a useful downstream measure, supported by qualified inquiries and booked appointments. Your real estate agent dashboard should still show reach and retention because they help explain where the journey may be breaking down. No single metric tells the whole story.
Should I combine paid and organic results? You can show an overall campaign total, but retain separate views for paid and organic distribution. Record spend, audience settings and creative versions so you can evaluate each approach fairly. Avoid presenting combined platform reach as a deduplicated audience unless you have evidence that supports it.
How many posts do I need before setting targets? There is no universal minimum. Begin with your own comparable campaigns and keep the underlying counts visible. Separate listings by relevant characteristics, such as price range and property type. Treat targets as provisional when the sample is small, then revise them as more comparable outcomes arrive.
Create the video, then measure what happens next
Diane turns property listings, photos and details into ready-to-publish videos, with narration, avatar presentation, cinematic editing and social formats. Use it for the production step, then connect each published video to your tracking workflow.
Before your next post goes live, assign its campaign label, confirm the contact route and define what counts as a qualified inquiry. Those small steps make the results easier to interpret and your next marketing decision easier to justify.